
NCUA Releases Q4 2023 State-level Credit Union Data Report
Federally insured credit unions experienced growth in loans and the share of credit unions with positive net income increased over the year ending in the fourth quarter of 2023, while delinquencies rose and assets and shares and deposits declined, according to the NCUA..
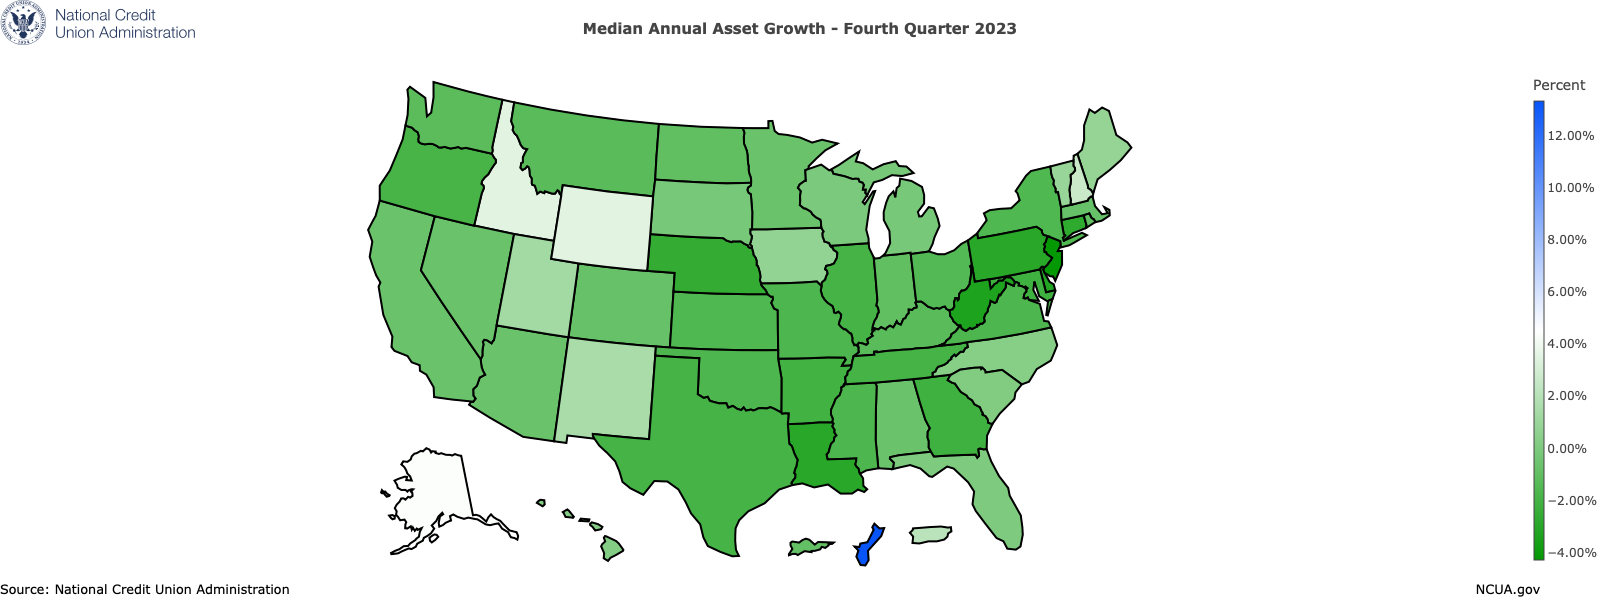
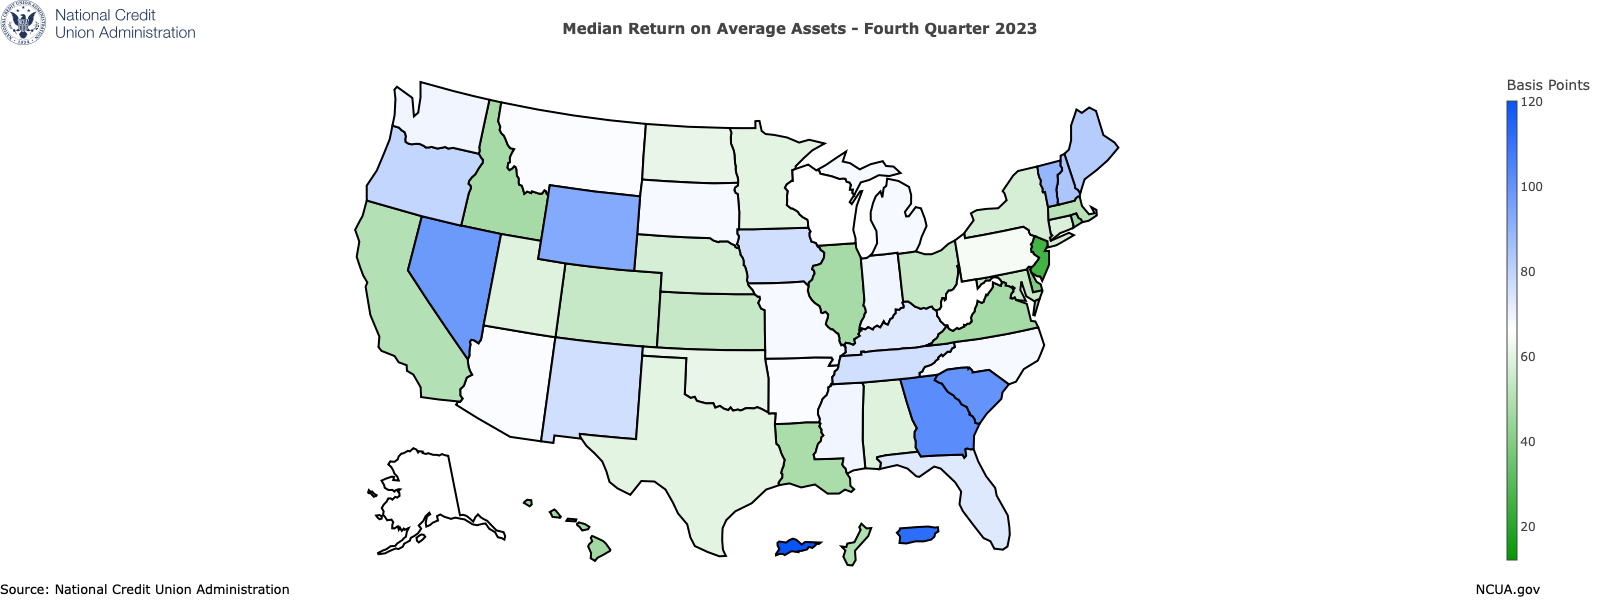
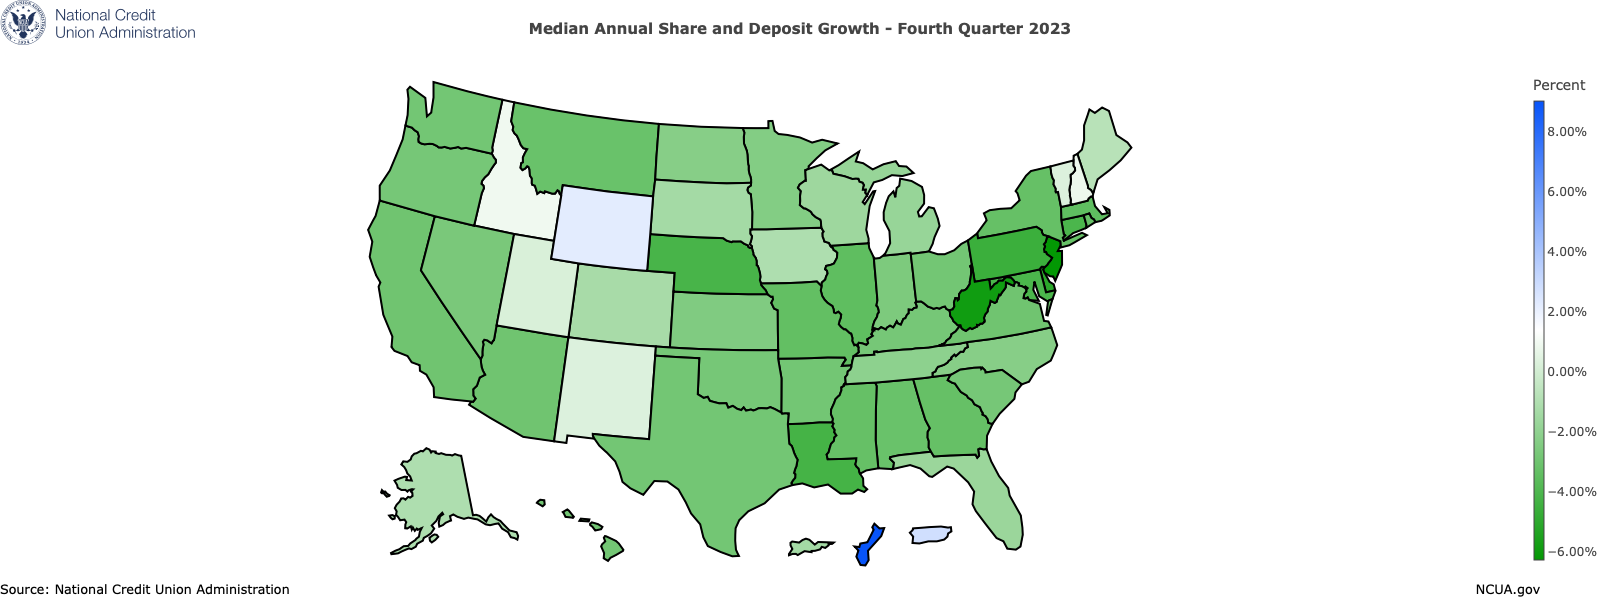
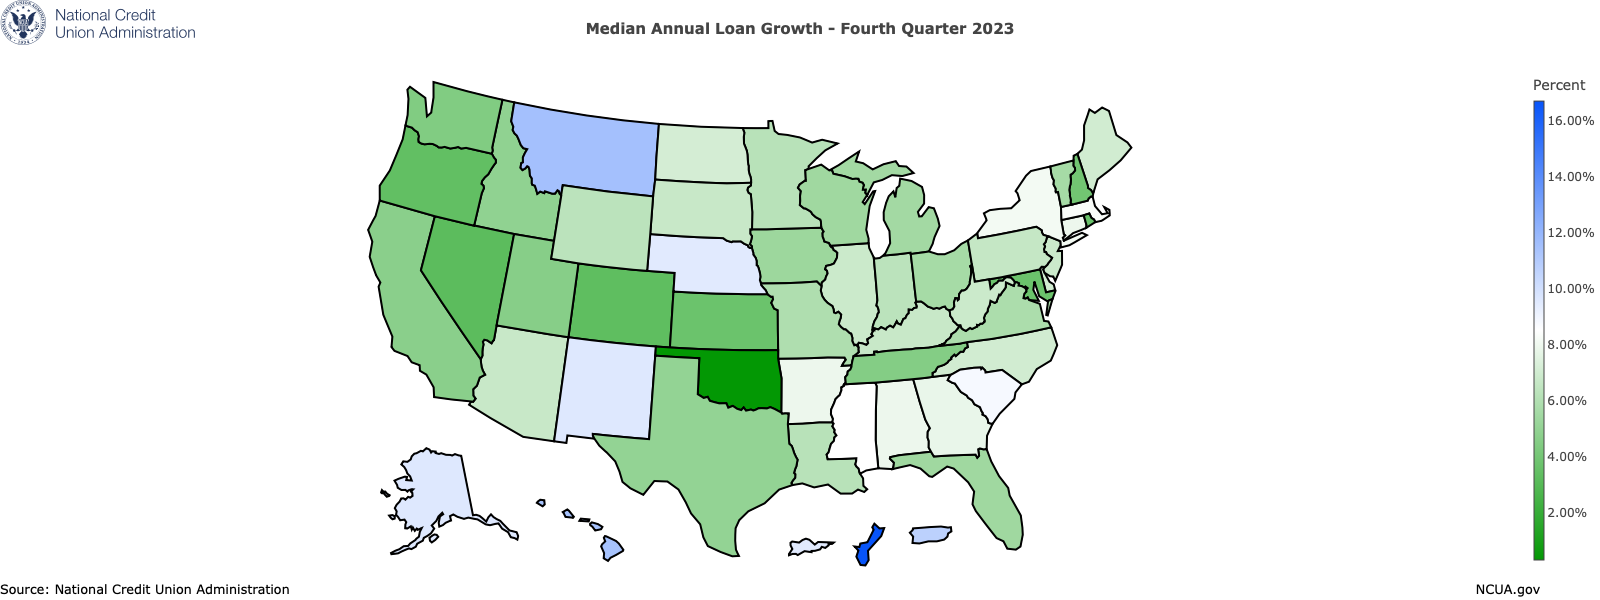
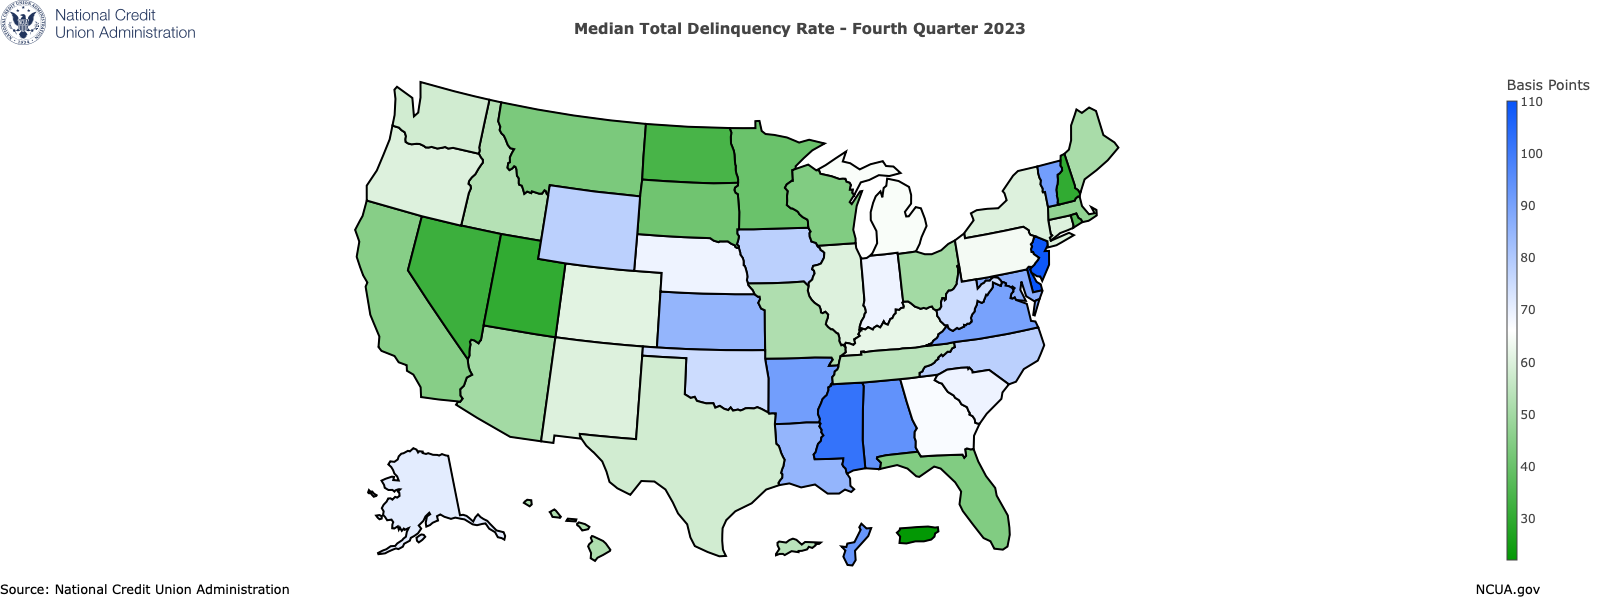
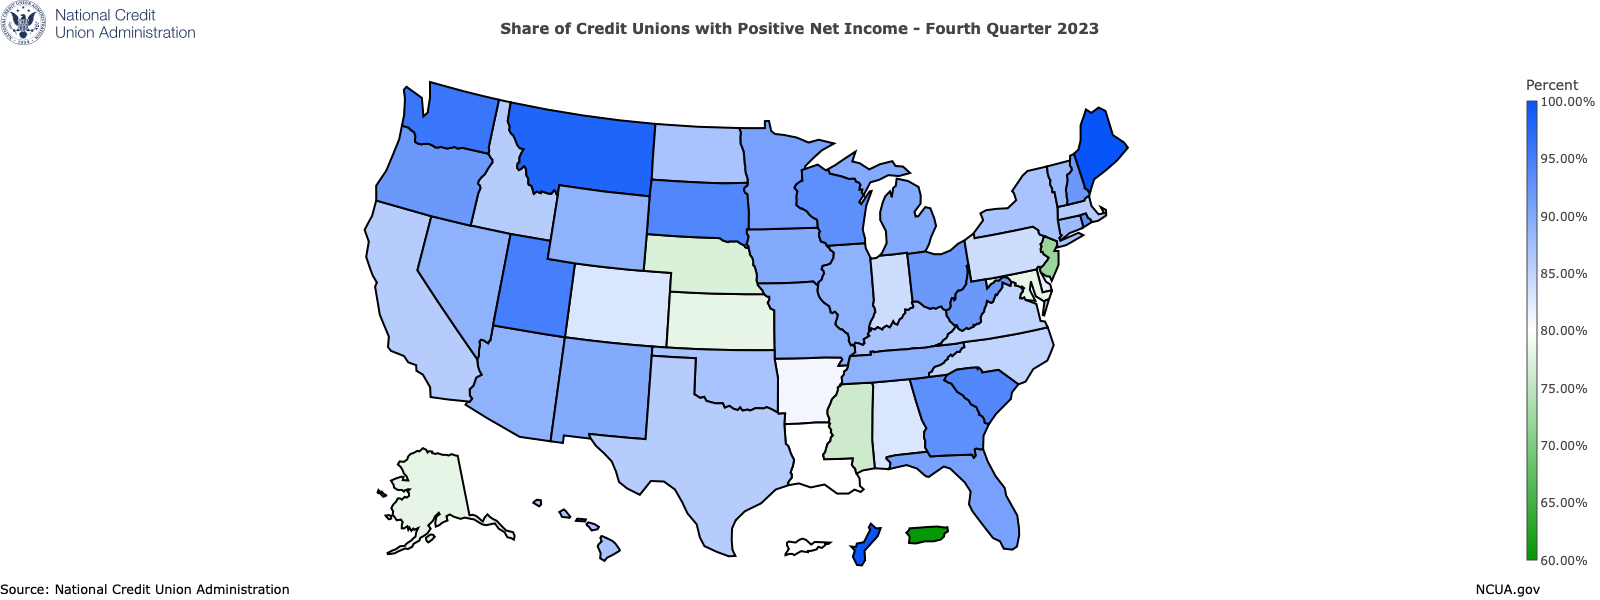
Nationally, assets among federally insured credit unions declined 1.5% at the median, and shares and deposits declined 3.0% over the year ending in the fourth quarter of 2023. Loans outstanding rose by 6.2% at the median over the year ending in the fourth quarter of 2023. The median total delinquency rate at the end of 2023 was 61 basis points, compared with 48 basis points at the end of 2022. Additionally, 87% of federally insured credit unions had positive year-to-date net income in the fourth quarter of 2023, compared with 85% in the fourth quarter of 2022.
The NCUA’s Quarterly U.S. Map Review tracks performance indicators for federally insured credit unions in all 50 states and the District of Columbia and includes information on two important state-level economic indicators: the unemployment rate and home prices.
The NCUA Quarterly U.S. Map Review for the fourth quarter of 2023 covers several key indicators of the financial health and viability of federally insured credit unions, including:
Median four-quarter growth in assets,
Median four-quarter growth in shares and deposits,
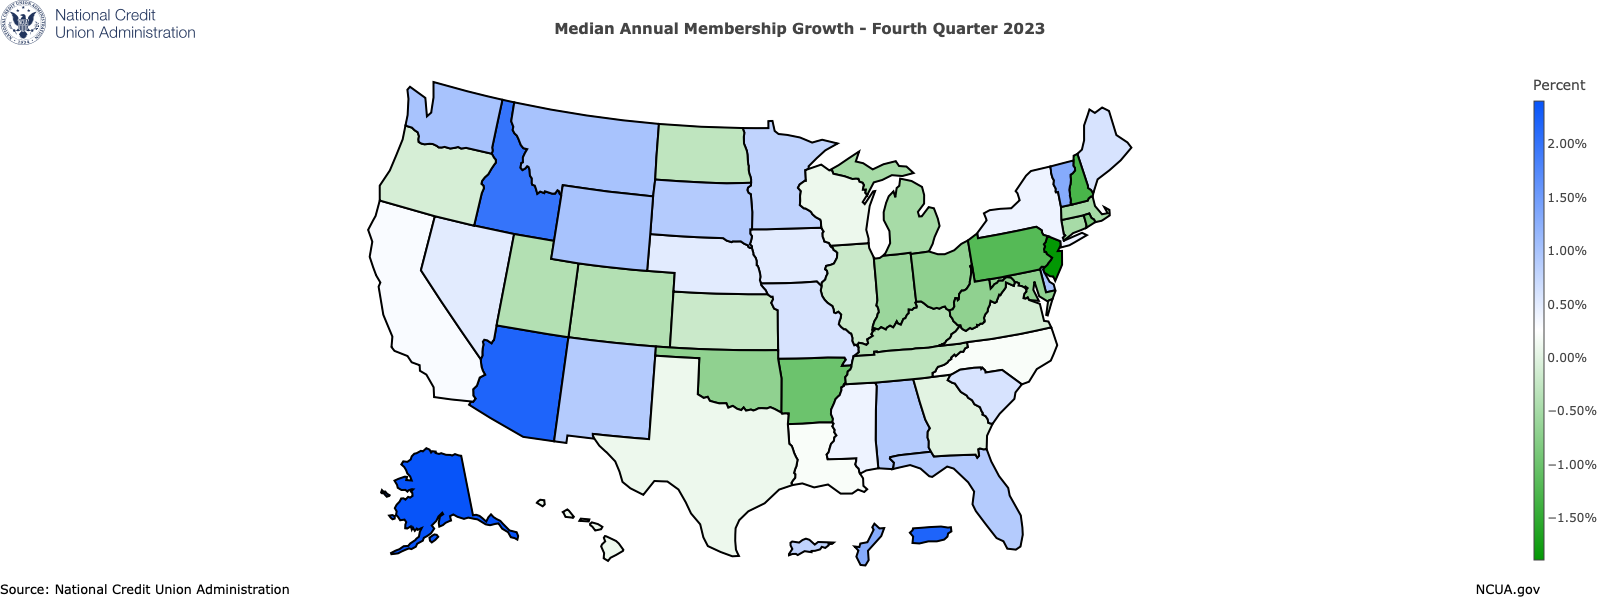
Median four-quarter growth in members,
Median four-quarter growth in loans,
Median delinquent loans as a share of total loans,
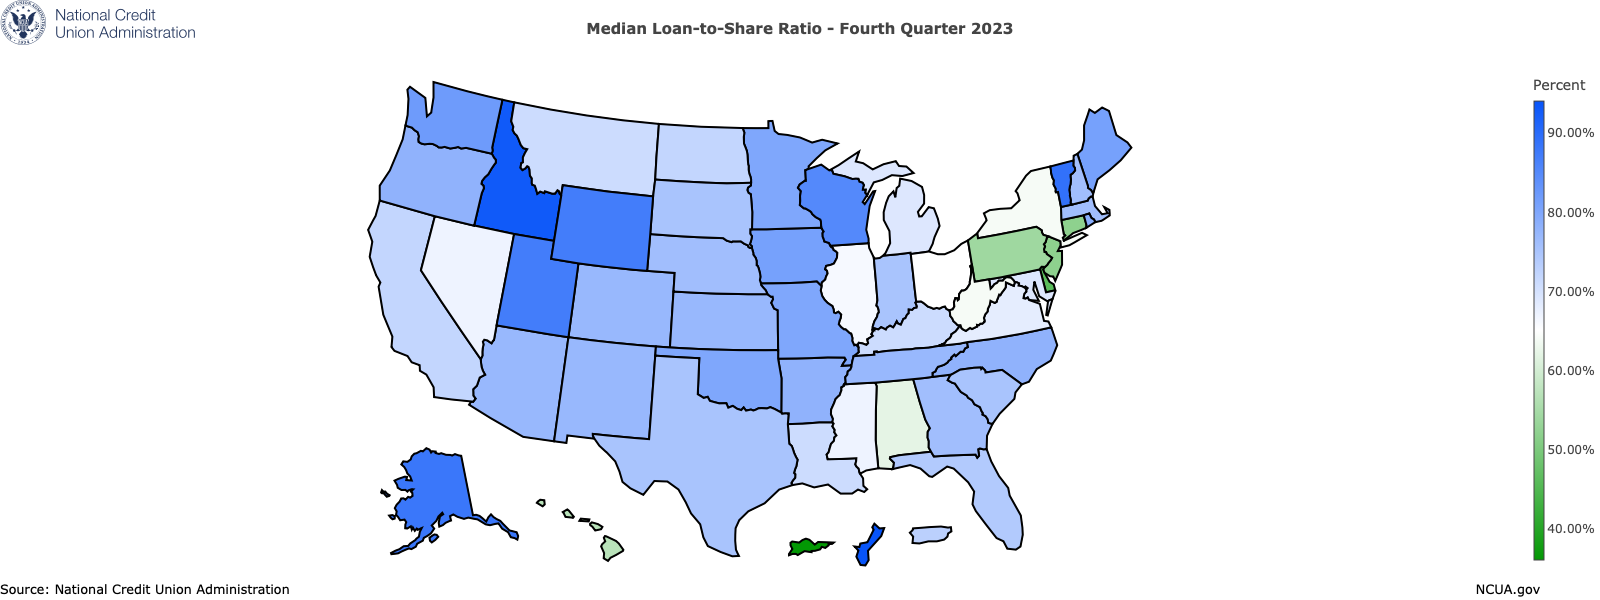
Median loans outstanding as a share of total shares and deposits,
Median year-to-date annualized return on average assets, and
Share of federally insured credit unions with positive year-to-date net income.
Four-quarter growth is the growth from the end of the fourth quarter of 2022 through the fourth quarter of 2023. Most maps shown in this review display medians, or the 50th percentile of the distribution of the variable. In other words, for a given metric, half of all credit unions had a value at or above the median, while the other half had a value that was less than or equal to the median.3
Data presented in this review are rounded. Unless otherwise noted, indicators in percentages are rounded to the nearest tenth of a percentage point, while indicators in basis points are rounded to the nearest basis point. In the legends, the data range in each color band excludes the value of the lower bound but includes the value of the upper bound of the range. Credit unions are included in their states of chartering or the states in which their headquarters are located.
NCUA makes information about the financial performance of federally insured credit unions available through its online Research a Credit Union tool. Through this link, you can locate information contained in an individual credit union’s Call Report as well as obtain a Financial Performance Report and summary documents about a credit union’s performance.